The Ubiquitous Self-Organizing Map is a novel variant of Kohonen's artificial neural network model specifically tailored for unsupervised learning from non-stationary streaming data.
Find Out More Share thisThe ubiquitous self-organizing map for non-stationary data streams
The Internet of things promises a continuous flow of data where traditional database and data-mining methods cannot be applied. This paper presents improvements on the Ubiquitous Self-Organized Map (UbiSOM), a novel variant of the well-known Self-Organized Map (SOM), tailored for streaming environments. This approach allows ambient intelligence solutions using multidimensional clustering over a continuous data stream to provide continuous exploratory data analysis. The average quantization error and average neuron utility over time are proposed and used to estimating the learning parameters, allowing the model to retain an indefinite plasticity and to cope with changes within a multidimensional data stream. We perform parameter sensitivity analysis and our experiments show that UbiSOM outperforms existing proposals in continuously modeling possibly non-stationary data streams, converging faster to stable models when the underlying distribution is stationary and reacting accordingly to the nature of the change in continuous real world data streams.
View / DownloadMaintains all properties of the original SOM, namely vector quantization, topological projection and input space density mapping.
Perfect for high-dimensional data exploration.
Copes with changes in the underlying distribution.
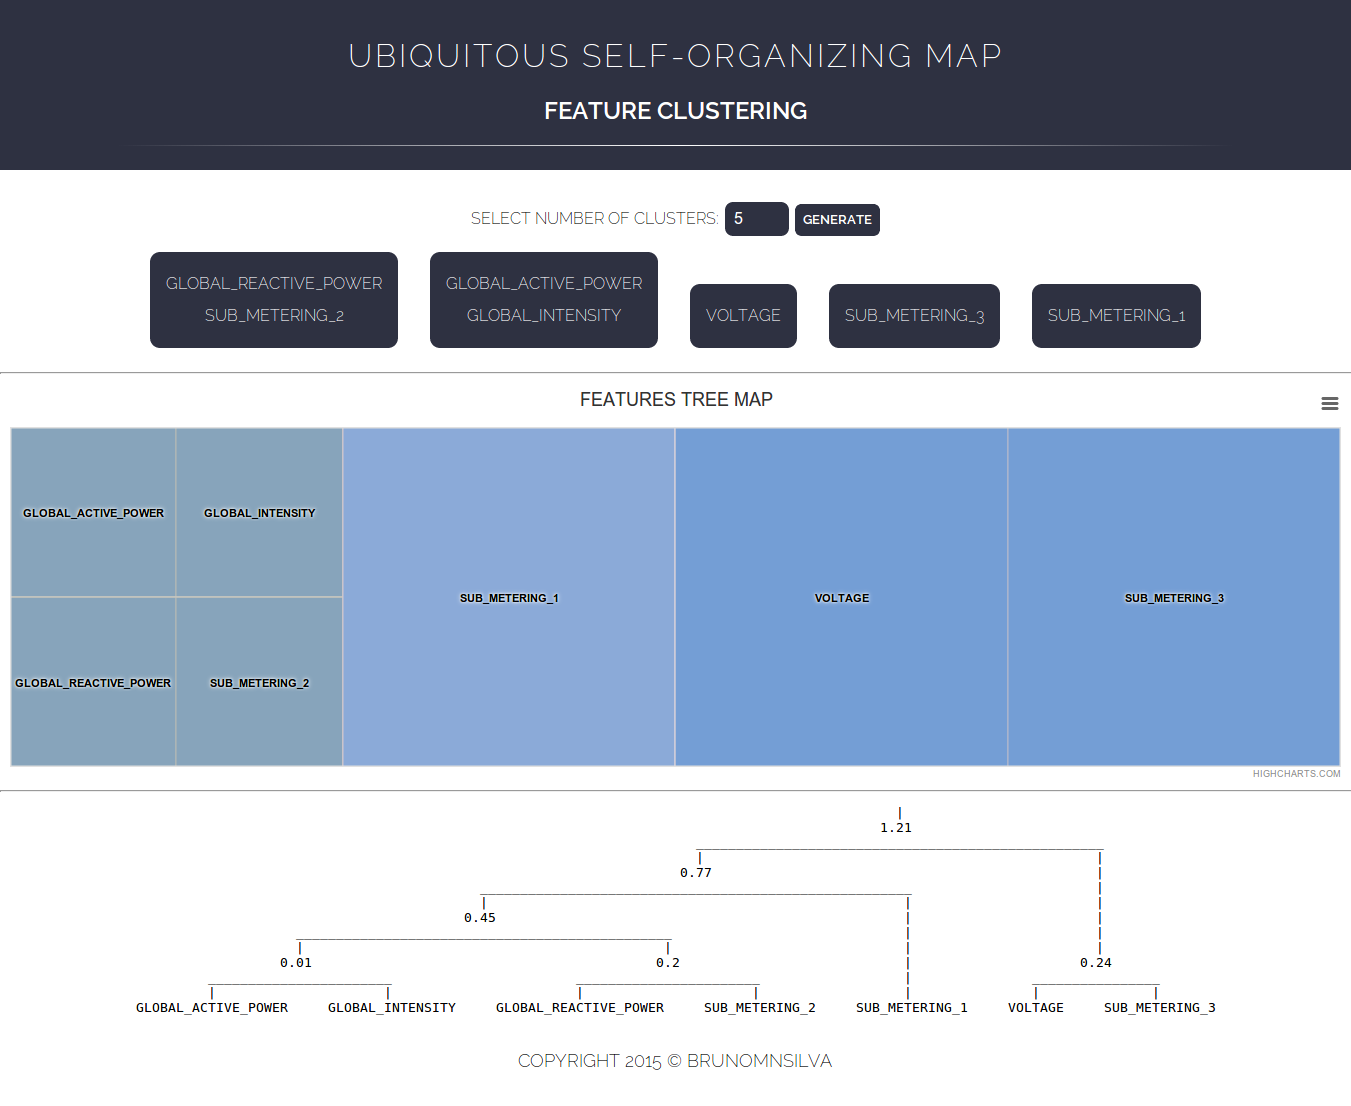
Easy to interpret visualizations let you detect arbitrary number of clusters and feature relationships and correlations.
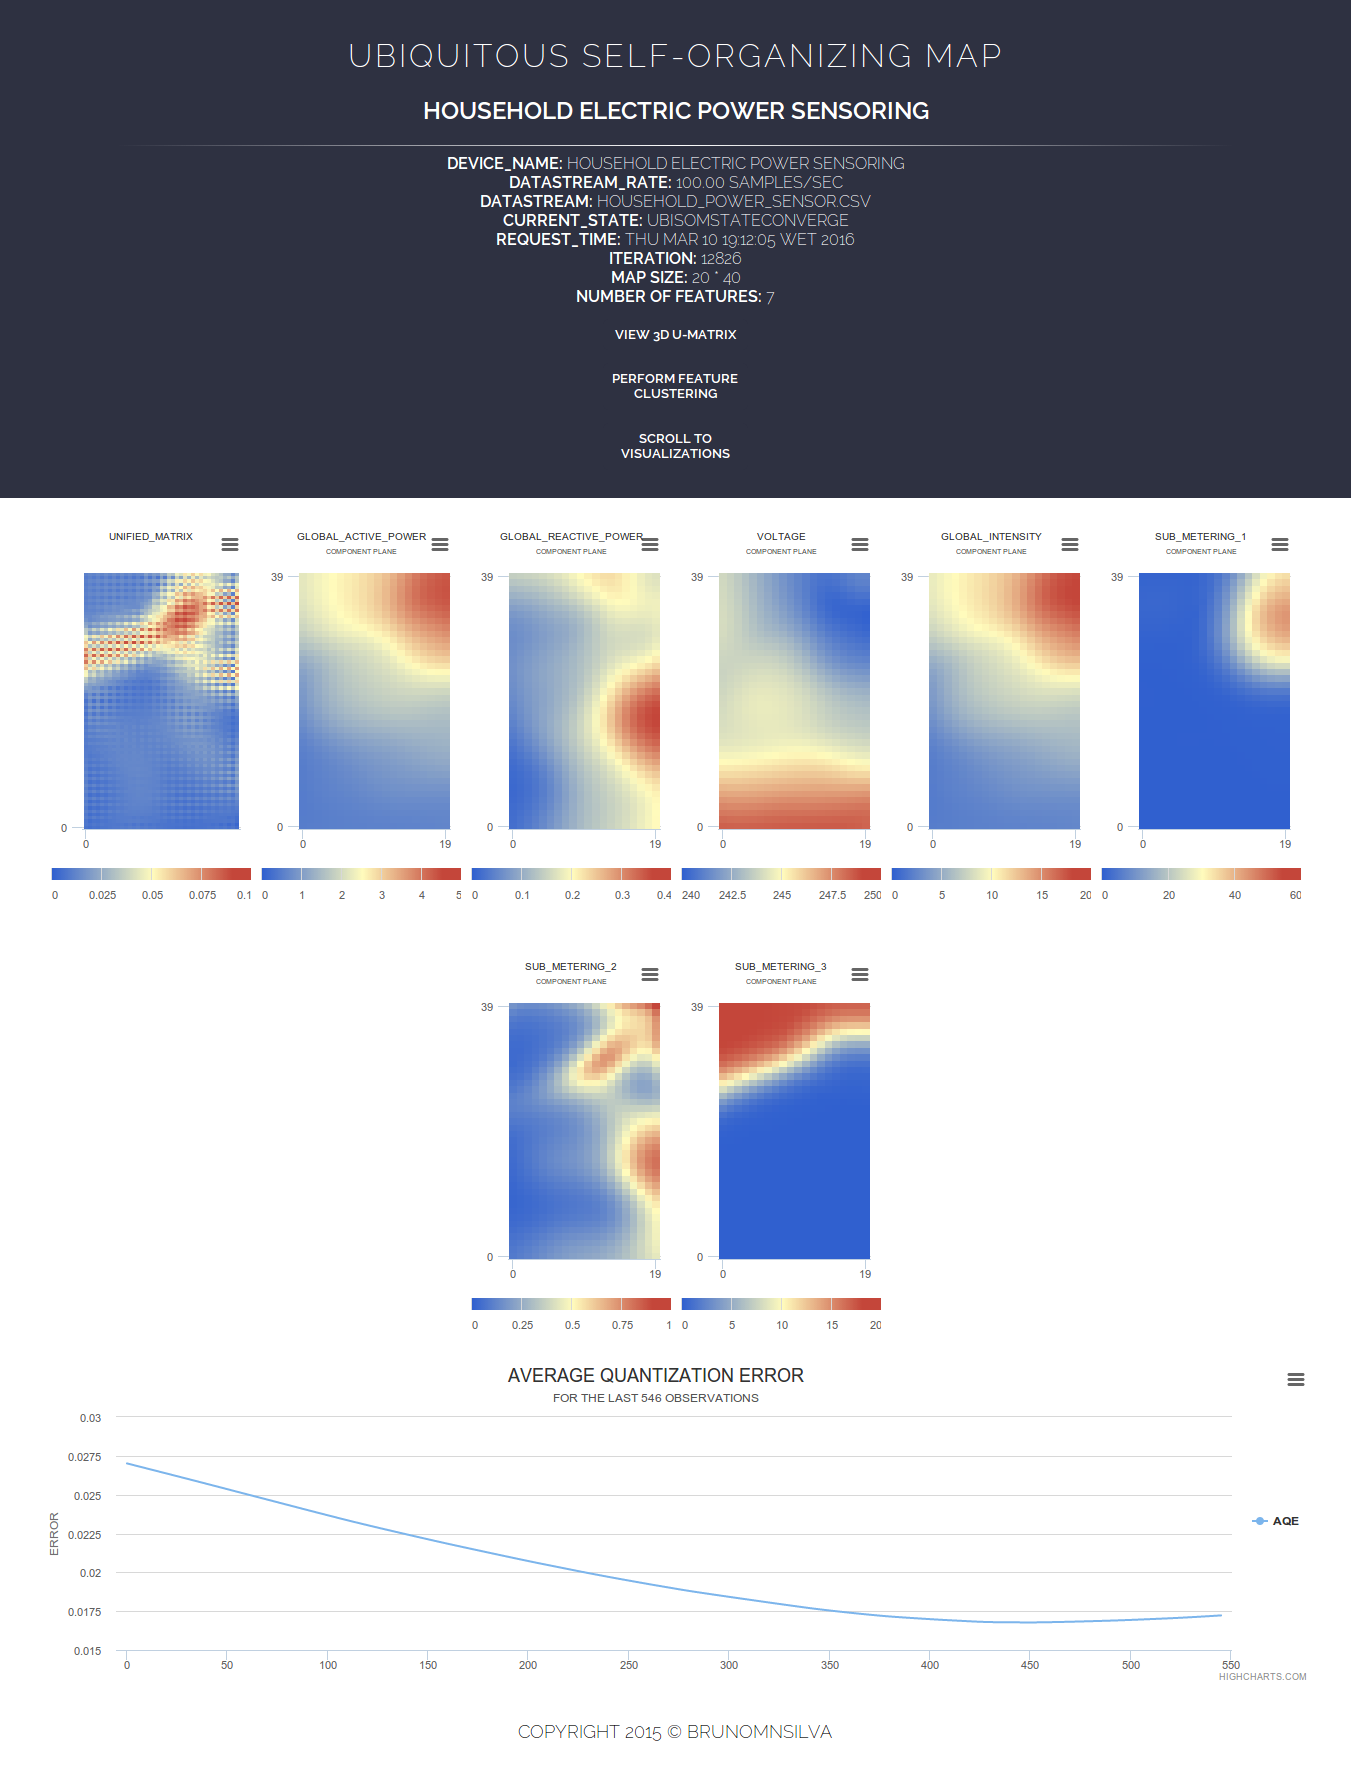
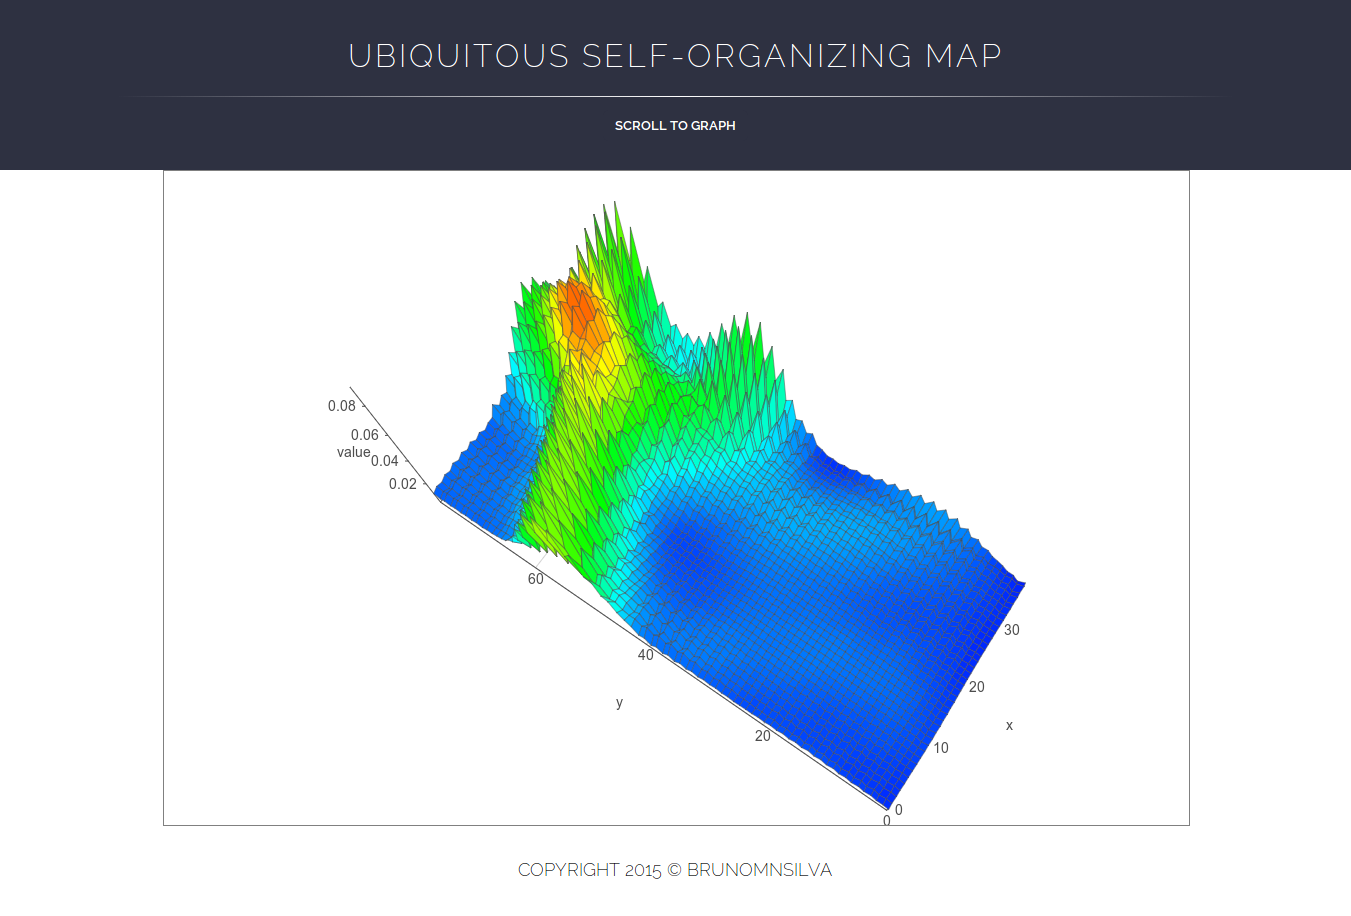
An existing developed framework wraps the UbiSOM algorithm in a stand-alone application with a built-in WebServer. The software can be adapted to use any source of data, e.g., file, socket, database, etc.; visualizations are then accessible through any modern browser (locally or remotely).
The framework allows further inter-operability, since data can also be returned in JSON format.
Figures below depict current available visualizations and methods accessible from the browser. In this example, the framework is learning from a Household Electric Consumption (UCI) data stream file.